Stats Sections for React and Tailwind
One honest number can do more than a paragraph of claims. Stats sections give your figures room, with clear labels and enough context to mean something. Choose a layout that suits how many numbers you really have, because three strong ones beat eight weak ones. Install one with a single command, then connect it to your own live data. Round figures honestly.


About stats sections
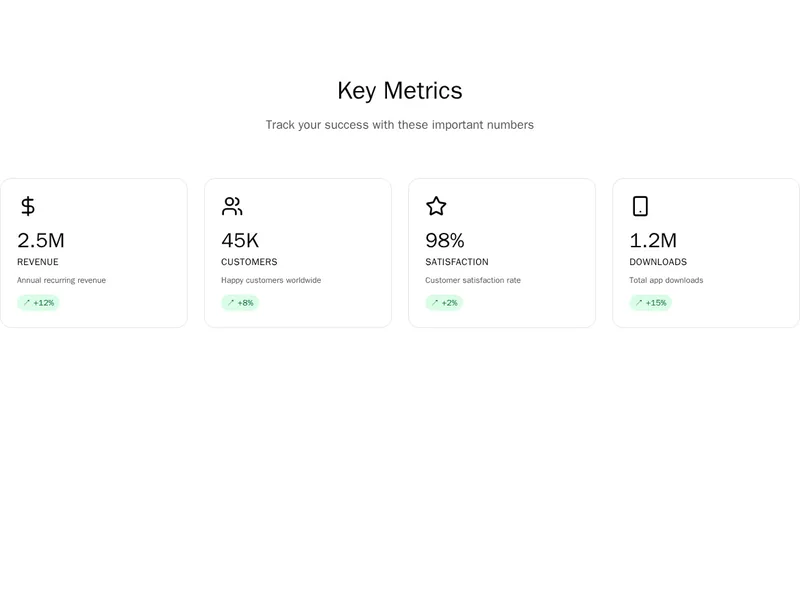
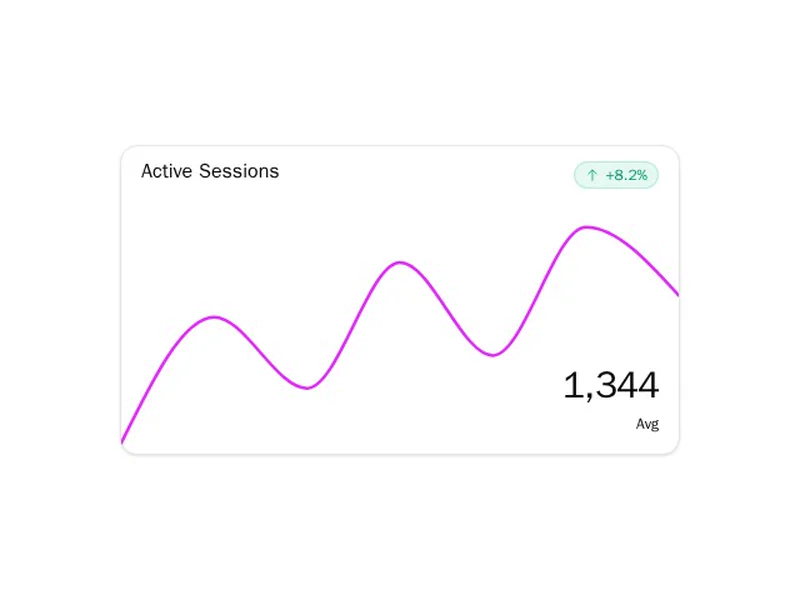
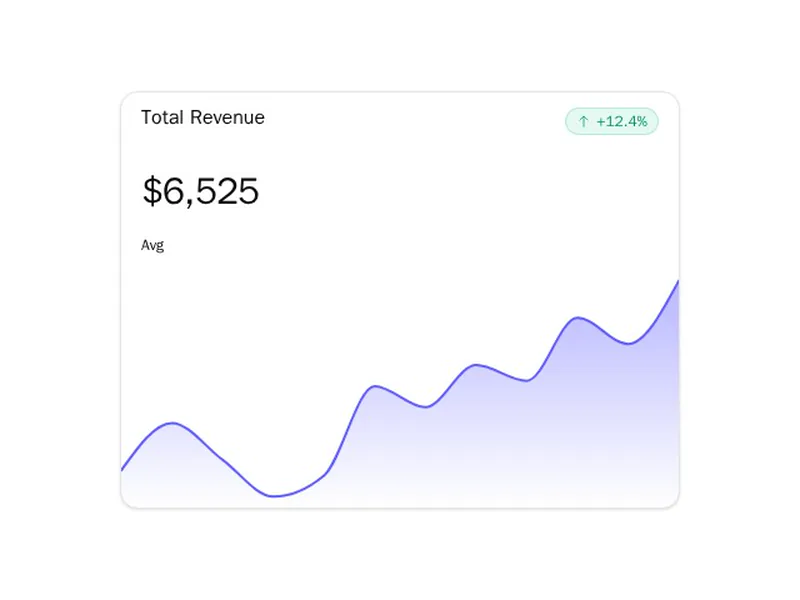
Stats sections put a product's key numbers front and centre: users, uptime, time saved, countries served, money processed. They come as rows of big figures with labels, cards with small charts, numbers that count up when they come into view and logos paired with results.
Pick a few numbers that matter to the reader and that you can stand behind, and say what each one measures. Round them so they're easy to read, keep them current, and make sure counting animations end on the right number for screen readers and people who skip motion.