Chart
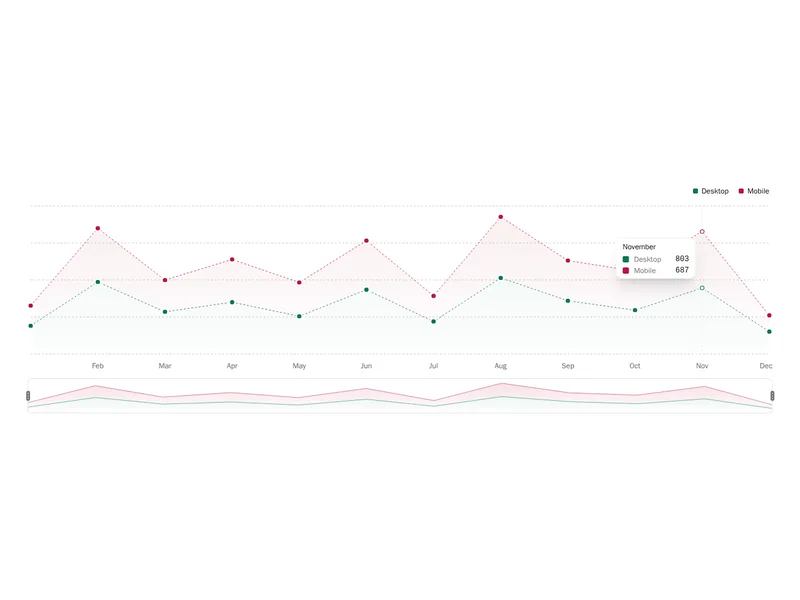
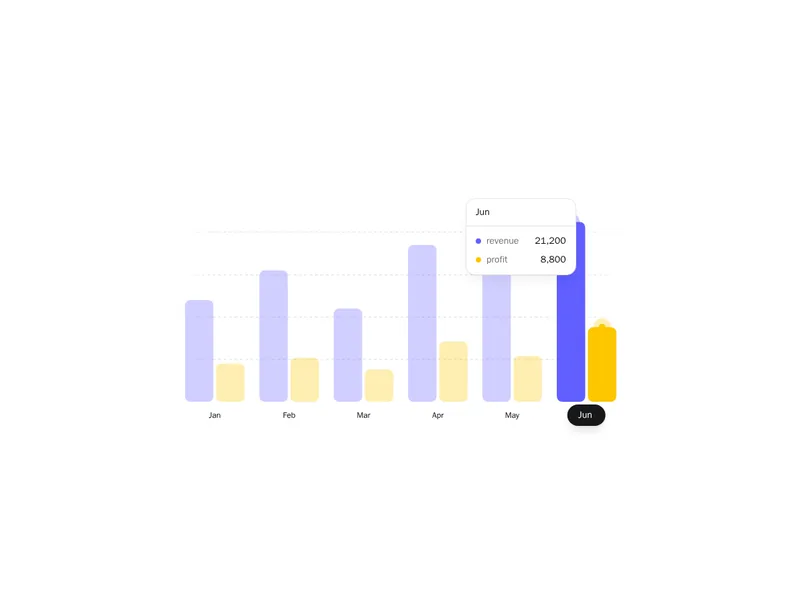
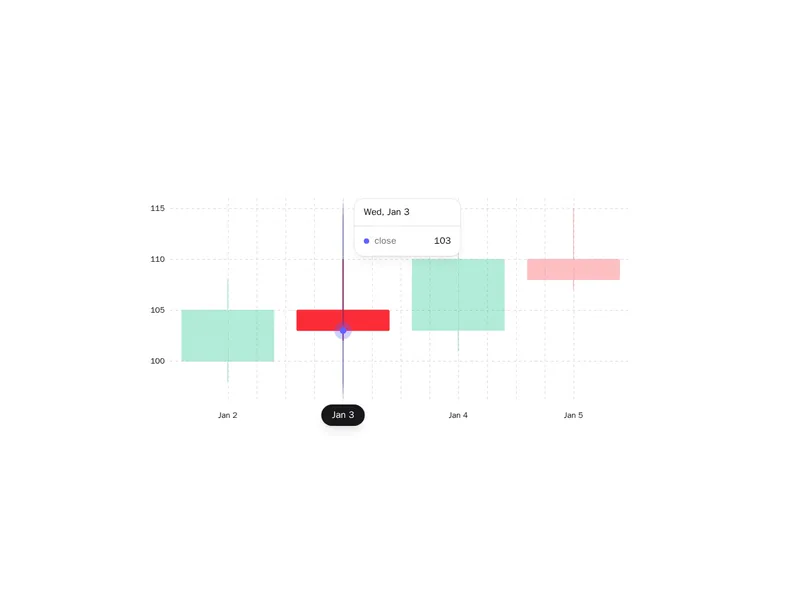
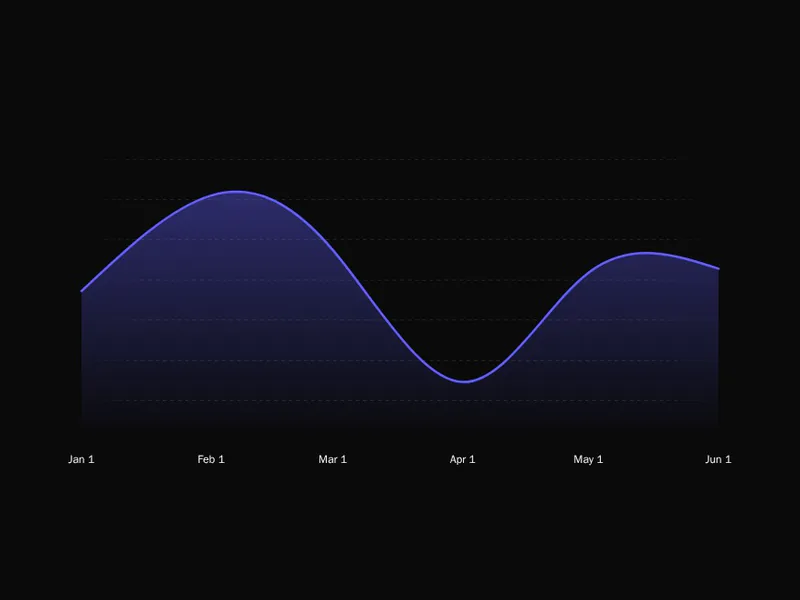
Renders an interactive line chart with a tooltip that follows the cursor. It shows data points, X-axis labels, and a smooth line. Use it to display time-series data or numerical trends.
 tom
Loading preview
Installation
terminal
npx layro-cli add @xxtomm/chart
npx layro-cli add @xxtomm/chart
bunx layro-cli add @xxtomm/chart
New project? Start with init. Writes third-party code and installs packages with scripts off.
Code
Sign in to see the code
Free, with GitHub, Google or email. The install command above works without an account.
Sign inVersions
1.0.0 · current
Nov 7, 2026
First release.